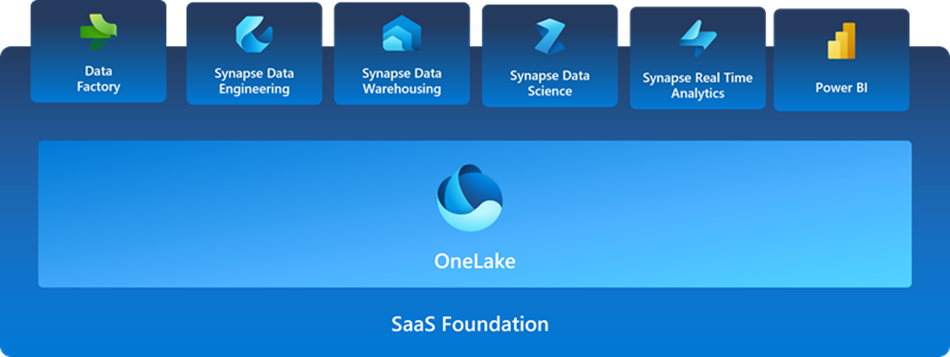
Navigating integrated workflow with Microsoft Fabric

VNB dives deep into Microsoft Fabric, an end-to-end analytics powerhouse that redefines how we harness the potential of data.

VNB dives deep into Microsoft Fabric, an end-to-end analytics powerhouse that redefines how we harness the potential of data.

VNB talks about the performance comparison of different reporting modes in Power BI when connecting to a data fabric, helping you make informed decisions to optimize your data-driven insights.

If you’ve been using Azure Analysis Services (AAS) for data modeling and analysis, migrating to Power BI can be a game-changer. This blog provides a step-by-step guide of migrating AAS to Power BI.

The Power BI Paginated Reports in a day workshop delivered by VNB BI & Analytics team empowers attendees with the technical knowledge required to create, publish, and distribute Power BI paginated reports. This is a full-day instructor-led workshop.

VNB talks about how to use Power BI to analyze inflation using some of its key features. Power BI is a powerful data visualization tool that has recently been updated to assist users in analyzing inflation data.

VNB talks about the new Microsoft Purview for power bi, an upgraded, unified data governance solution. The system facilitates businesses to define and apply DLP policies for sensitive content.

A situation like COVID-19 where the hospitals are challenged to manage supplies and make decisions as they meet an increase in number of patients, Microsoft Power Platform template for Emergency Response Solution became a very efficient help. VNB Power Platform team has been an early adopter of this solution and have implemented it for many

ArcGIS by Esri is now a built-in feature in Power BI to provide enhanced mapping capabilities taking it beyond the presentation of points on a map to a whole new level. It enables to attach layers of demographic data to a map with ease. The combination of this location-based data layers on a map with

COVID-19 has rapidly become a world-changer. While the world’s Healthcare professionals prepare for the unknown, many of us are seeking useful news and updates. Recently, The Center for Systems Science and Engineering (CSSE) at Johns Hopkins University released a COVID-19 Power BI Dashboard that has a fantastic interactive map.

In this series, so far, we have embedded a Power BI report/tile in canvas app and then in model driven apps. Now we will do the reverse, where we will embed PowerApps in Power BI. When there is more focus on action based on analytics, it makes more sense to embed a business app in
