Navigating integrated workflow with Microsoft Fabric
1. Introduction
In the ever-evolving landscape of data-driven decision-making, having a seamless and comprehensive analytics solution is nothing short of a game-changer. Enter Microsoft Fabric—an end-to-end analytics powerhouse that redefines how we harness the potential of data. Imagine a world where every facet of data engineering, integration, warehousing, real-time analysis, data science, and business intelligence converges seamlessly, creating a symphony of insights that resonate across your organization.
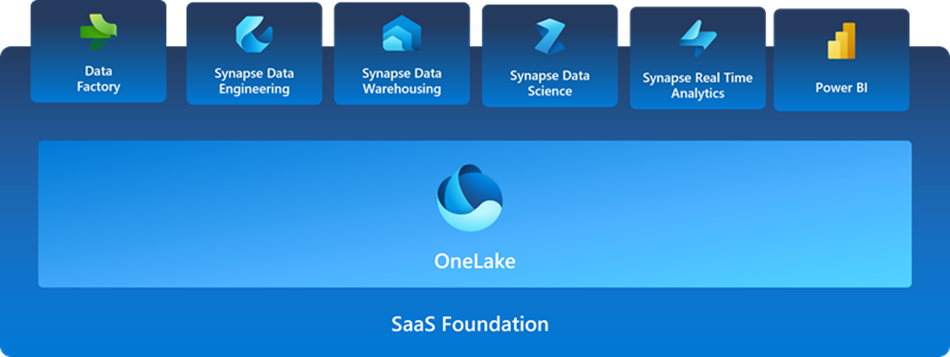
In its current iteration, Microsoft Fabric presents a comprehensive lineup of seven pivotal workloads, each designed to empower you in distinct dimensions of analytics:
- Data Factory: The backbone of data engineering, allowing you to create, schedule, and manage data pipelines with unprecedented ease.
- Synapse Data Engineering: A powerhouse for creating, deploying, and managing big data solutions that fuel your insights.
- Synapse Data Science: A playground for data scientists, where advanced analytics and machine learning converge to uncover hidden patterns.
- Synapse Data Warehouse: The nucleus of data warehousing, providing a robust and scalable environment to house your valuable information.
- Synapse Data Real-Time Analytics: Harnessing the power of real-time insights, this workload enables rapid decision-making during dynamic data streams.
- Power BI: Transforming raw data into visual narratives, Power BI delivers business intelligence at its finest, empowering users to comprehend data immediately.
- Data Activator: Catalysing data integration, this workload enables harmonious flow across your analytics architecture.
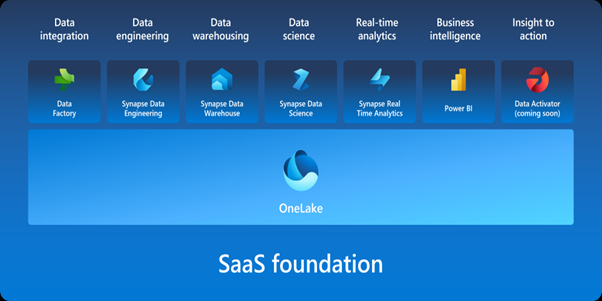
All these workloads coalesce under the banner of ‘OneLake.’ This unified platform is where the magic happens—a single stop solution that encapsulates every analytical capability within a singular ecosystem.
In this blog, we’re going to show you how to make things easier by using the tools in Microsoft Fabric. Imagine having a set of tools that work like a team to help you do a task from start to finish. We’ll guide you through the steps of using these tools and how they work together to create something cool.
2. Use Cases
Creating a workflow to import data from traditional SQL Server and from excel SharePoint to sink data into warehouse to enable reporting with Power BI in import mode using warehouse as data source.
2.1 Creating a warehouse to sink the tables from source
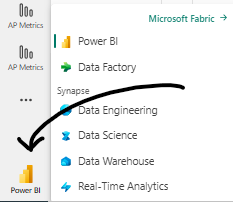
On the left bottom of your Power BI Service window, you will find the Power BI tab which on click will give display you other options of workloads as shown below.
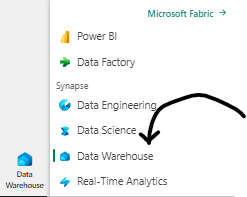
Click on Data Warehouse to switch the workload mode to create a Warehouse to sink the data. Now click on Warehouse (Preview) to create a new Warehouse and you will be prompted to enter a for your warehouse.
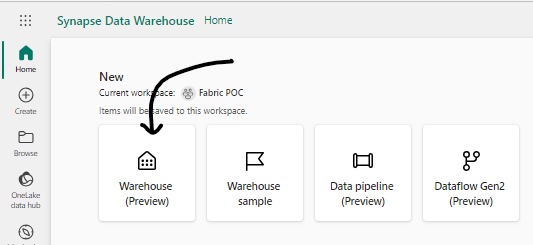
Once your warehouse is loaded, it will look something like this as shown below.
2.2 Creating pipelines using Data Factory to copy data from excel SharePoint to fabric warehouse
On the left bottom of your Power BI Service window, you will find the Power BI tab which on click will give display you other options of workloads as shown below.
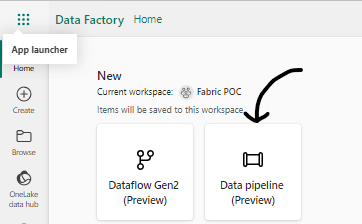
Click on Data Factory to switch the workload mode to create pipelines to copy the data from source and sink it to target. Now click on Data pipeline to create a new Pipeline and you will be prompted to enter a for your pipeline.
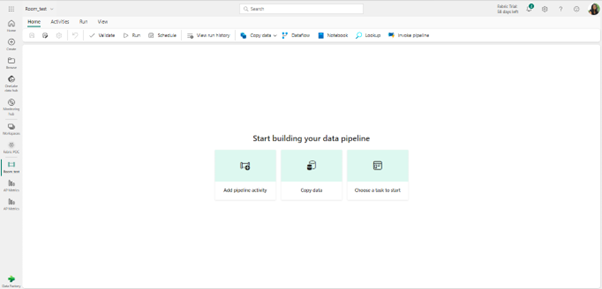
Now you will be taken to a page where you can build your pipeline where you can choose to Add pipeline activity, copy data, and choose a task to start as shown below. You will also see the name of the pipeline on the top right of this window which you can also modify on a drop down.
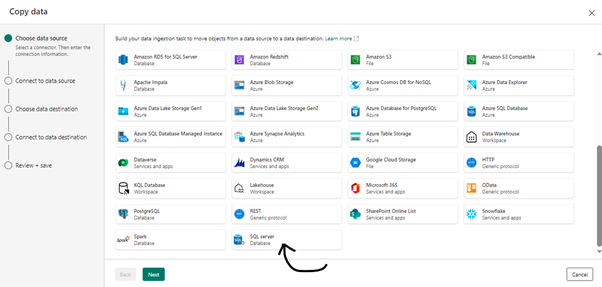
Here, we are going to use copy activity to copy data from our SQL Server to Warehouse. So, we click on “Copy data” and we will be prompted a window as shown below to choose the source (SQL Server Database in our case)
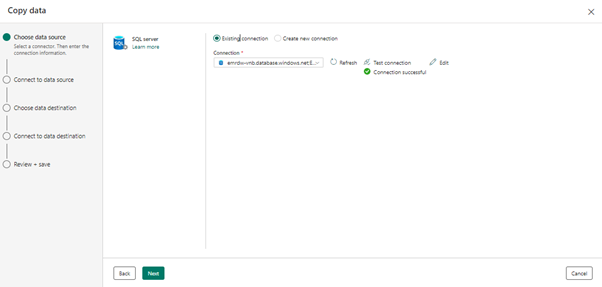
- On the prompt, put the Server name, database and the connection credential and test the connection. You can reuse a connection already created for new pipelines; you will not have to recreate a connection to the same server every time.
- As your next step, you choose the tables you want to copy, and you can select multiple tables. Alternatively, fabric also gives you an option to query the table you want and click on the next button to choose the destination which data source you want to define as your destination. You create a connection here again similar to what you created for source. We are sinking the data to the warehouse in this scenario which was created in the first step.
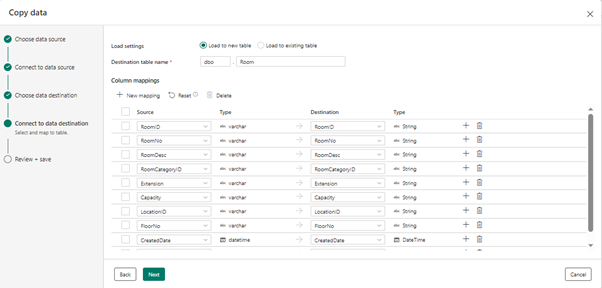
- In the load settings if you have a table structure in place in your database already for the table you are copying, you can choose the table from the drop down of Load to existing table. If you want to create a new table, you can select Load to new table, and this will create a new table with the column mapping that you set up. Make sure you have appropriate data types set to each columns while mapping.
- Review the settings that confirm everything is in the right place. Save and run the activity to start copying data immediately.
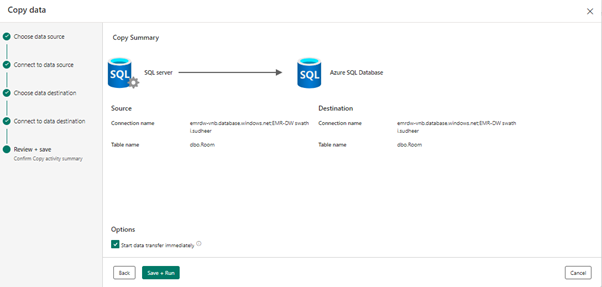
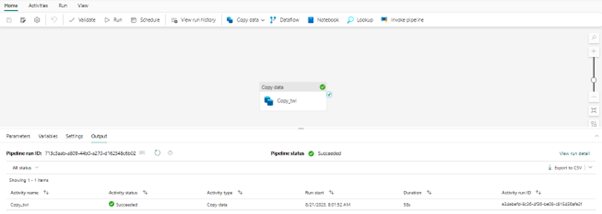
Depending on the data size the activity will run long. On successful completion of the pipeline run, the pipeline status will show success along with other pipeline details as shown below.
2.3 Creating dataflows to load tables from excel as a data source
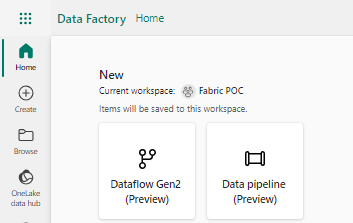
In Data Factory workload mode, click on Dataflow Gen2 (Preview) to create dataflows to copy the data from SharePoint and sink it to warehouse. You will be prompted to enter a for your dataflow.
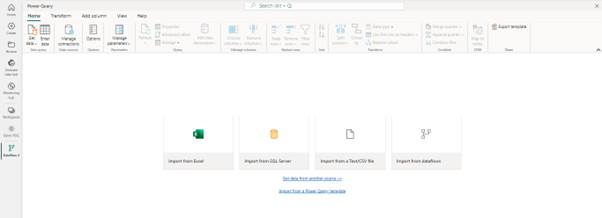
You will be redirected to a new window where you will find various options as shown below. Click on Import from Excel.
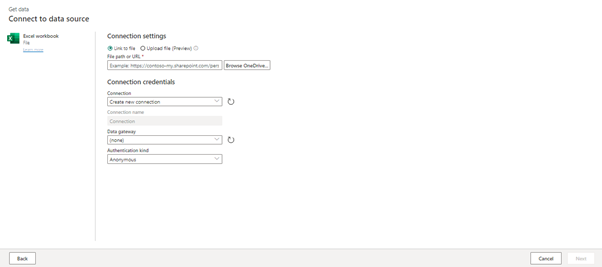
Now you will be prompted a window where you can enter the SharePoint path where the excel file is located and test the connection
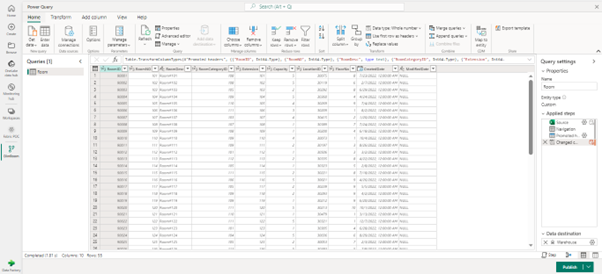
Once you have loaded the table from excel, you can choose the data destination as shown in the right bottom of the below given image and publish the dataflow. On successful completion of the publication, the table will now appear among other tables in your warehouse that you loaded in the previous steps.
2.4 Connecting Microsoft Fabric from Power BI
Once we have loaded all the required tables, we can access the Fabric warehouse from Power BI desktop in order to create a report.
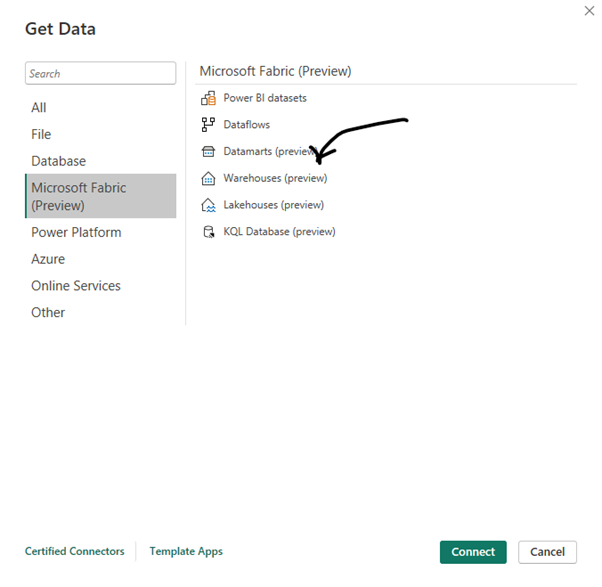
After connecting to Fabric warehouse select the warehouse you loaded the tables into.
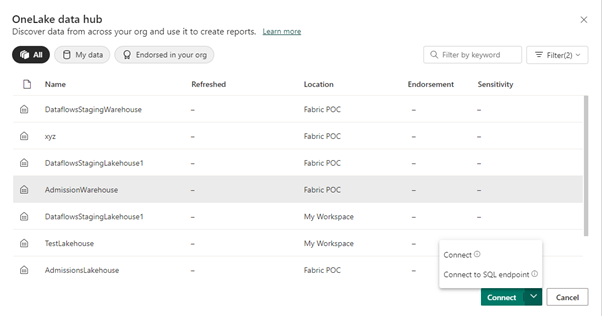
You will find two options there as you can see in the image above.
- Connect – which means you are creating a live connection to automatically defined data model.
- Connect to SQL endpoint – this lets you connect directly to the data source and define your own data mode.