Inflation Analysis using Power BI

1. Introduction
Inflation analysis is important for both policymakers and investors. It has been a hot topic in the financial world for decades, and its impact on the global economy can be felt. Power BI is a powerful data visualization tool that has recently been updated to assist users in analyzing inflation data. In this blog, we will look at how to use Power BI to analyze inflation using some of its key features.
1.1 What exactly is inflation?
Inflation is defined as the rate at which the general level of prices for goods and services rises, causing purchasing power to fall. The percentage change in the Consumer Price Index (CPI) from one year to the next is used to calculate it. Inflation can be a problem, as well as financial analysts and policymakers. It sheds light on inflation trends and aids in forecasting future inflation rates.
2. Analysis using Power BI
2.1 Data Collection:
The first step in using Power BI to analyze inflation is to gather data. Power BI includes the ability to connect to various data sources.
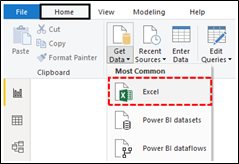
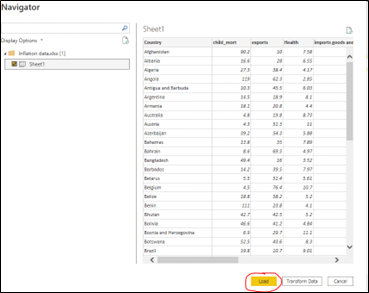
- Open Power BI and select the “Get Data” option.
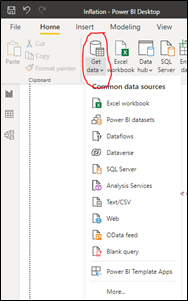
- Choose “Excel workbook” from the list of available data sources.
- Choose the file from the saved location and click “Open.”
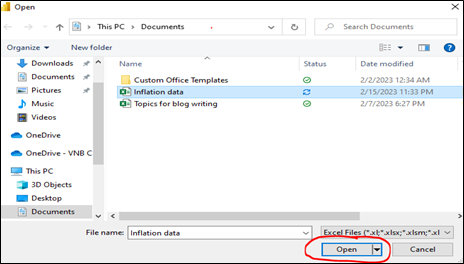
- To load the data into Power BI, click the “Load” button.
2.2 Cleaning Data:
The next step is to clean the data after it has been loaded into Power BI. Data cleaning entails removing missing values, duplicates, and any other errors found in the data.
2.3 Modeling Data:
The next step is to create a data model after cleaning the data. A data model is a graphical representation of data that is used to create reports and visualisations. The Power Query Editor is used to create a data model in Power BI.
- To open the Power Query Editor, click the “Transform Data” button.
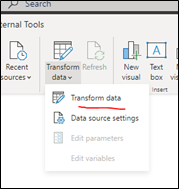
- Choose the data table that was imported into Power BI and the columns that will be used for data analysis.
- After you’ve chosen your columns, click the “Close & Apply” button to save the data model.
2.4 Visualization of Data:
- After creating the data model, the next step is to create visualisations. Power BI includes several visualisations for analysing inflation data. Some popular inflation analysis visualisations include:
- Line charts are used to depict inflation trends over time.
- Scatter plots – are used to demonstrate the relationship between inflation and other variables such as GDP growth or unemployment.
- Bar charts – are used to depict the distribution of inflation across various categories such as food, housing, and transportation.
- Heat maps are used to depict the magnitude of inflation in various regions or countries.
- Power BI also allows users to create interactive dashboards that allow them to interact with data in real time.
2.5 AI-POWERED VISUALS:
Power BI includes AI-powered visuals to assist users in analysing inflation data. The AI-powered visuals analyse data and provide insights using machine learning algorithms. This feature is especially useful for users who are new to statistical analysis and want to gain insights quickly.
Key influencers, a decomposition tree, and anomaly detection are among the AI-powered visuals. Key influencers aid in identifying the variables that have the greatest impact on inflation. The decomposition tree aids in the visualisation of trend and seasonality in inflation data. Anomaly detection aids in the identification of unusual or unexpected changes in inflation data.
2.5.1 Key influencers
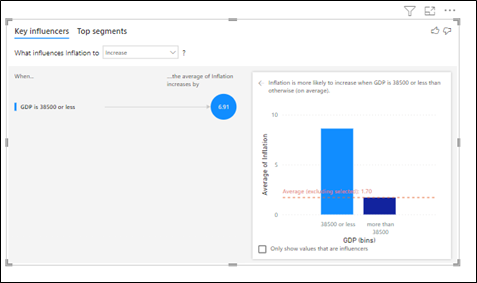
They are used to assess each factor individually. Here I want to analyze inflation based on the GDP of a country. For that:
- Click on Key influencers in Visual pane and enter the required fields.
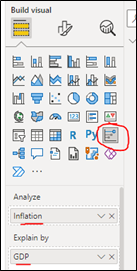
- It will display us how inflation is analysed based on GDP of a country.
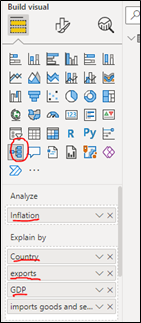
2.5.2 Decomposition Tree
Decomposition tree visual allows us to visualise data across various categories and dimensions.It allows us to drill down into the data for in-depth analysis.
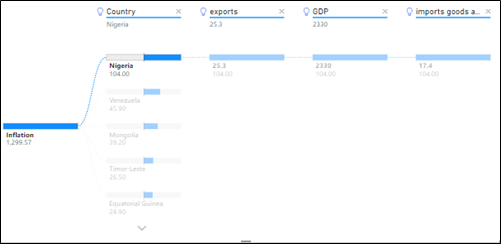
- To analyse Inflation of a country based on GDP,Exports and Imports this decomposition tree might be helpful.
- Click on Decomposition tree visual in Visual pane and enter the fields.
Inflation analysis is visualized as below:
2.6 Analyzing Inflation trends:
- With the Analytics pane in Power BI Desktop, you can add dynamic reference lines to visuals, and provide focus for important trends or insights.
- For this, Click on Analytics icon in visualization area.
- The Analytics pane only appears when you select a visual on the Power BI Desktop canvas
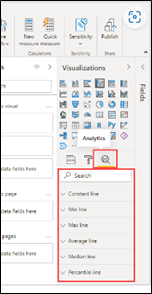
To view the available dynamic reference lines for a visual, follow these steps:
- Select or create a visual, then select the Analytics icon from the Visualizations section.
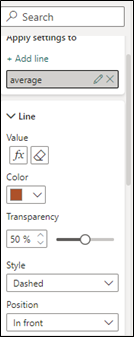
- Select the type of line you want to create to expand its options. This example shows Constant line selected.
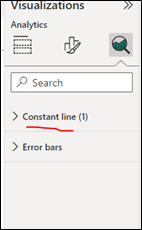
- To create a new line, select + Add. Then you can name the line. Double-click the text box and enter your name.
- Now you have all sorts of options for your line. You can specify its Color, Transparency percentage, Line style, and Position (compared to the visual’s data elements). You might also choose whether to include the Data label.
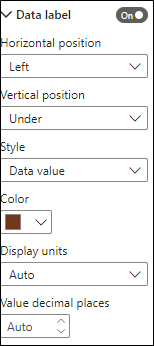
- If you want to have a data label appear, change the Data label from Off to On. When you do so, you get many more options for your data label.
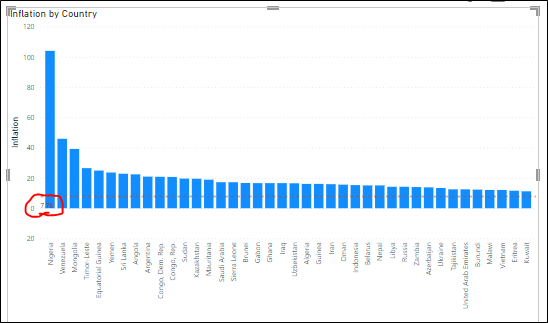
- Here the circled value is the data label showing the average value of inflation of all countries and the dashed line represents the average value of inflataion of different countries.
- Power BI now includes forecasting capabilities to assist users in forecasting future inflation rates. The forecasting feature creates a forecast based on historical inflation data using time-series analysis. This feature is especially helpful for policymakers who must make decisions based on future inflation rates.
2.7 Natural language processing (NLP)
Power BI now includes NLP capabilities to assist users in analyzing inflation data. The NLP feature enables users to ask natural language questions and gain insights from the data. This feature is especially helpful for users who are unfamiliar with the data or analysis.
The NLP feature includes a Q&A visual that allows users to ask natural language questions. Users can, for example, ask “What is the inflation rate in the United States?” and receive a visualisation of the inflation rate over time. The NLP feature also suggests questions and assists users in better understanding the data.
2.7.1 Add Q&A to a report
- To add Q&A to a report in Power BI Desktop or the Power BI service, you can:
- Add a Q&A visual.
- Add a Q&A button.
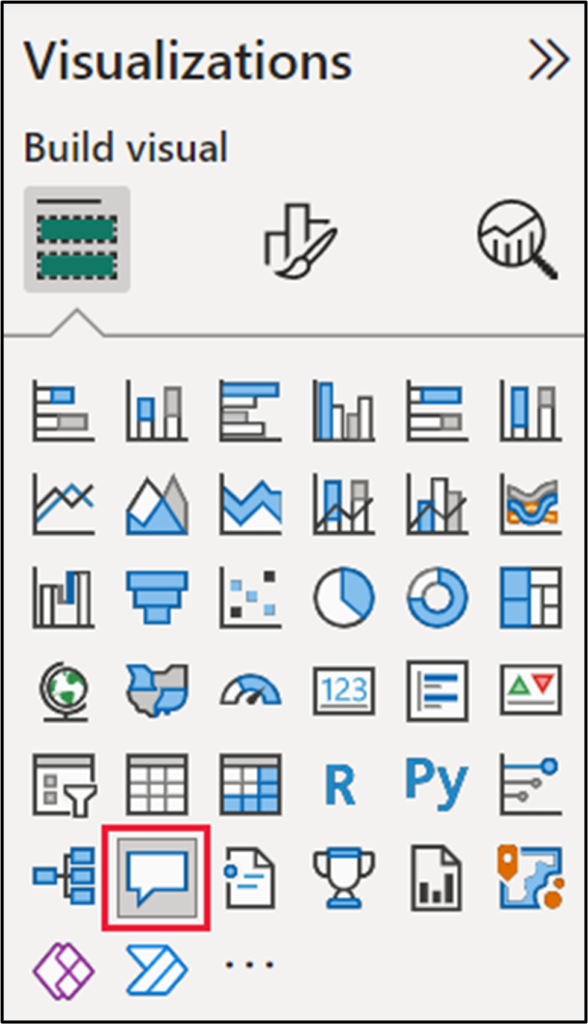
- To add the Q&A visual to a report, select the Q&A icon, or select the Q&A visual in the Visualization pane. You can also double-click anywhere on the report canvas to automatically insert the Q&A visual.
- To add a button, select Buttons > Q&A from the Insert ribbon. You can completely customize the Q&A button image.
2.8 Conclusion
Power BI has added new features to assist users in analyzing inflation data. AI-powered visuals, forecasting, natural language processing, and custom visuals are among the new features. These features help users gain insights into inflation trends and make informed decisions based on inflation data. Power BI has become a valuable tool for policymakers, financial analysts, and business intelligence analysts with the latest updates.