Unravelling Power BI Reporting Modes with Microsoft Fabric

1. Introduction
Power BI, a leader in business intelligence and data visualization, offers multiple reporting modes for creating dynamic reports. When connecting to a data fabric – a unified data architecture that seamlessly integrates various data sources – choosing the right reporting mode becomes crucial. In this blog post, we’ll delve into the performance comparison of different reporting modes in Power BI when connecting to a data fabric, helping you make informed decisions to optimize your data-driven insights.
Before we dive into the performance evaluation, let’s briefly revisit the three primary Power BI reporting modes when connecting to a warehouse in Fabric:
Connect: Create Live connection to the automatically defined data model.
This mode maintains real-time connectivity to the data fabric while leveraging the power of the fabric’s processing capabilities. It’s suitable for complex data models and real-time insights.
Connect to SQL Endpoint: Connect directly to your data source and create your own data mode.
- Import Mode: This mode involves importing data into Power BI for analysis. It’s suitable for scenarios where data transformation and aggregation are required before reporting. Data is refreshed on a schedule, providing consistent insights.
- Direct Query Mode: In this mode, Power BI queries the data fabric in real-time, ensuring the reports reflect the latest data changes. It’s ideal for scenarios requiring real-time data insights without storing data within Power BI.
2. Use Cases
In the previous blog, we spoke about how we can create a workflow using various workloads in fabric. We created a warehouse which stored the tables, populated using a pipeline where our source was SQL server and SharePoint. In a similar manner, we are going to load various tables to create a model to query them from Power BI.
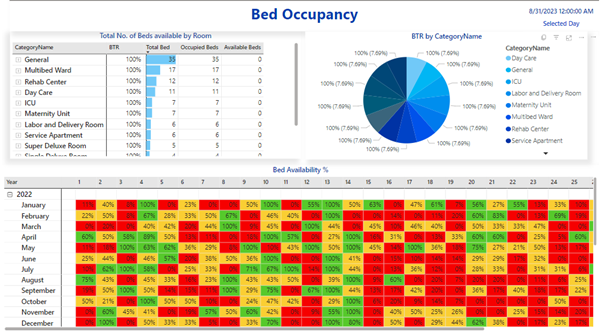
For this blog post, we are creating a report called Bed Availability displaying 3 visuals:
- Total no. of Beds available by Room
- BTR by Category name
- Bed availability percentage
The tables required to create a model which encompasses data to create this report are as follows along with their sources:
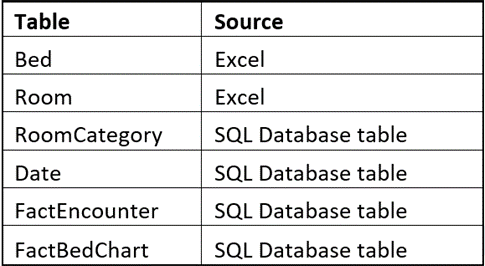
Now, let’s load these tables in different manner as described in the previous blog post and assess the performance of these reporting modes in the context of fabric:
2.1 Creating a report with Import from Fabric comparing Import mode to traditional SQL Server
In this part, we’ll connect to Fabric in Import mode and compare it to the traditional SQL Server method. Through a series of comprehensive comparisons, we gain a deeper understanding of the strengths and limitations of each method. We explore three scenarios that showcase the versatility of the Import mode.
2.1.1 Report with end-to-end Fabric as data source
In this part we will be Creating a Report with Fabric Only and will show you how easy it is to make reports using Fabric as the main source of data. In order to do that, we will load all the 6 tables mentioned above into the warehouse, called AdmissionWarehouse in our case (as given in the last blog post). Following are the steps to do so:
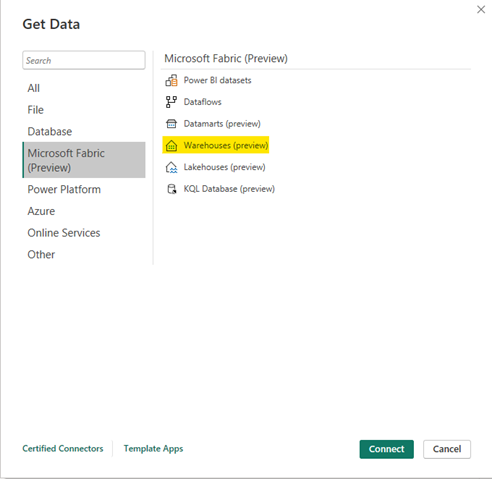
- Open Power BI Desktop and click on get data.
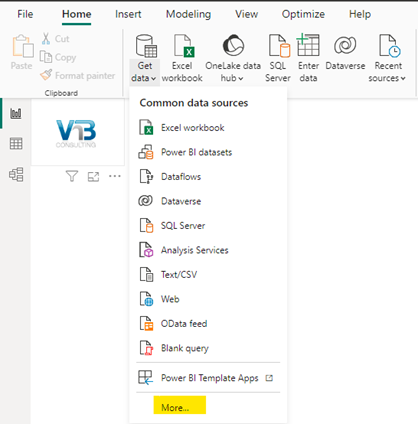
- Click on more options or search for Microsoft Fabric (Preview), select Warehouses (Preview) as a data source and click on Connect at the bottom of the dialog box.
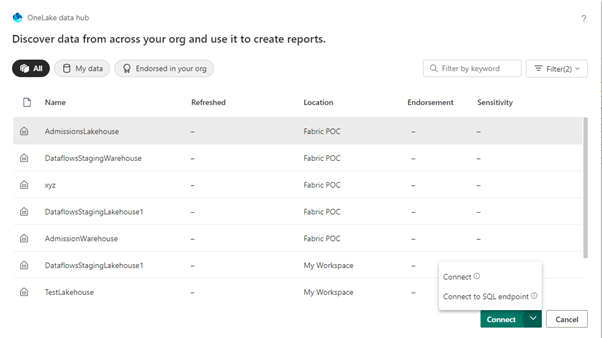
- By clicking on the Connect button, you will be prompted to pick the Warehouse you want to connect to. At the bottom of the window, on clicking the downward arrow, you’ll see two options here.
- Connect: Which is to be selected to create Live connection to the automatically defined data model.
- Connect to SQL Endpoint: We choose this to connect directly to the data source and create your own data mode.
For our use case, we are going to Connect to SQL Endpoint to create an Import mode for our model creation.
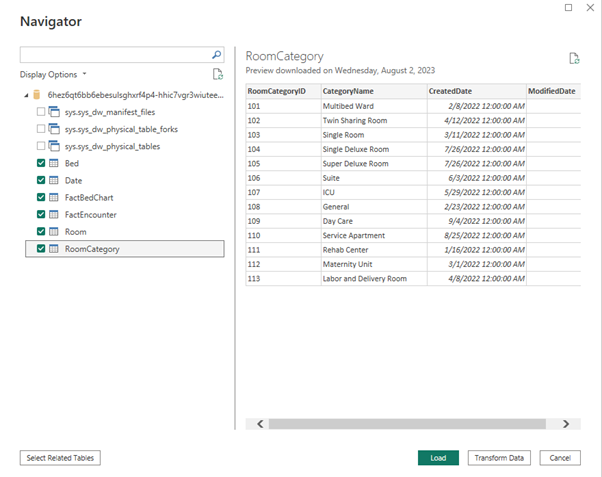
- You will now be prompted a window to select the tables that you want to load to create your model just like how we do usually in Power BI. We will select all the listed tables and load them.
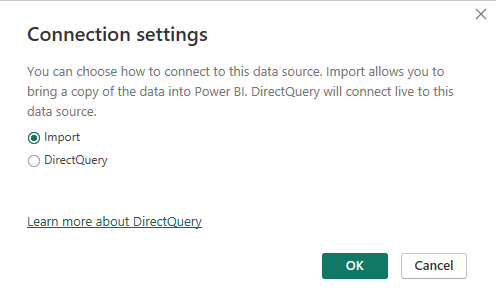
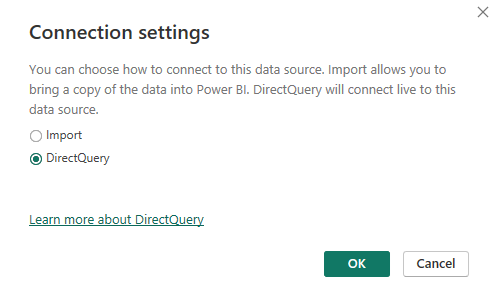
- After you click on load, you will be then prompted the Connection setting to choose how you want to connect to the data source. We will choose to go by import mode for our use case, which will bring a copy of data into Power BI.
Once the tables are loaded, you can create the report on top of this model.
2.1.2 Report with Fabric and SharePoint as data source
In this use case, we will load Bed and Room into Power BI using a SharePoint connection and we will load the rest of the tables from fabric as we did in use case 2.1.2 in import mode. We will be making Reports with Fabric and SharePoint to discover how Fabric and SharePoint can work together to create reports that you and your team can collaborate on.
2.1.3 Report with only SQL Server as data source
In this use case, we will load all the tables into Power BI using a SQL Server database connection in import mode. So, this part, we will be creating reports using SQL Server and learn about the benefits of using SQL Server in contrast with Fabric for creating the same report.
2.2 Creating a report with direct query to Fabric comparing direct query to traditional SQL Server
Now, let’s switch to the Direct Query mode and see how it works with both Fabric and SQL Server. We’ll break it down into three scenarios as we did before:
2.2.1 Direct query report with end-to-end Fabric as data source
To understand how Fabric’s Direct Query mode can help you make real-time reports using data straight from Fabric, we can repeat the steps 2.1.1 till step 4.
On step 5, when you are prompted to set the Connection setting to choose how you want to connect to the data source, we will choose to go by Direct query mode now for our use case, which will connect live to the data source.
2.2.2 Direct query report with Fabric and SharePoint as data source
Similar to what was done for Import mode, in this part, we will query table Bed and Room using a SharePoint connection and we will query the rest of the tables from fabric as we did in use case 2.2.1 in direct mode. With this we explore the collaborative and immediate nature of reports that emerge from using Direct Query in Fabric and SharePoint.
2.2.3 Direct query report with only SQL Server as data source
In this use case, we will load all the tables into Power BI using a SQL Server database connection in direct mode.
To summarize, we have run performance analysis on all 6 reports and compared their performance in the excel attached.