Create Dataflow to Load Data from Excel Web Source to Lakehouse

In our last Data Factory series using Fabric blog, we saw how to create a Dataflow in Data Factory to load the data from Web API connector to warehouse. We also discussed how to load the CSV files to a warehouse. In this blog, let’s explore a new use case. In this article, we will explore our knowledge on importing data from excel file to Lakehouse with simple transformations using Dataflow.
Setting up Dataflow in Data Factory
Click on Data Factory from the Fabric workspace. It will open a new window from where you can choose Dataflow Gen2 and Data pipeline. Select the Dataflow Gen2. You will see the editor like below.
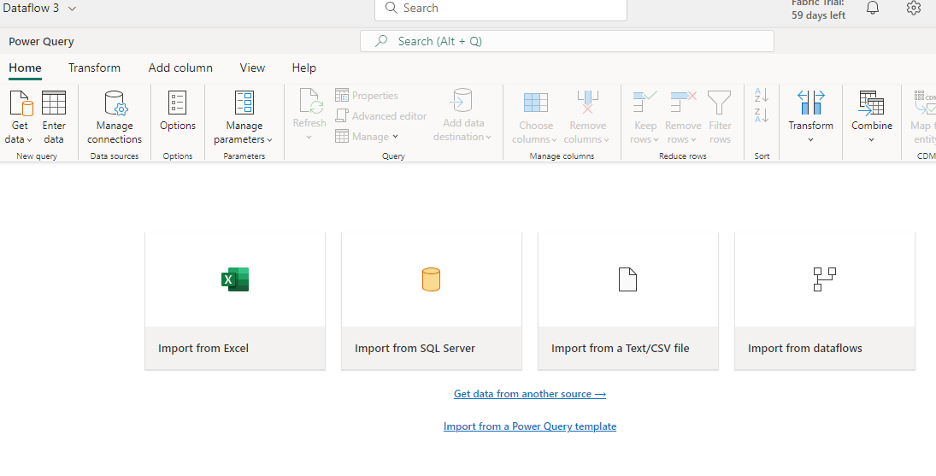
Click on Import from Excel option from the screen. You will be see a window where you can enter the SharePoint location of the Excel files.
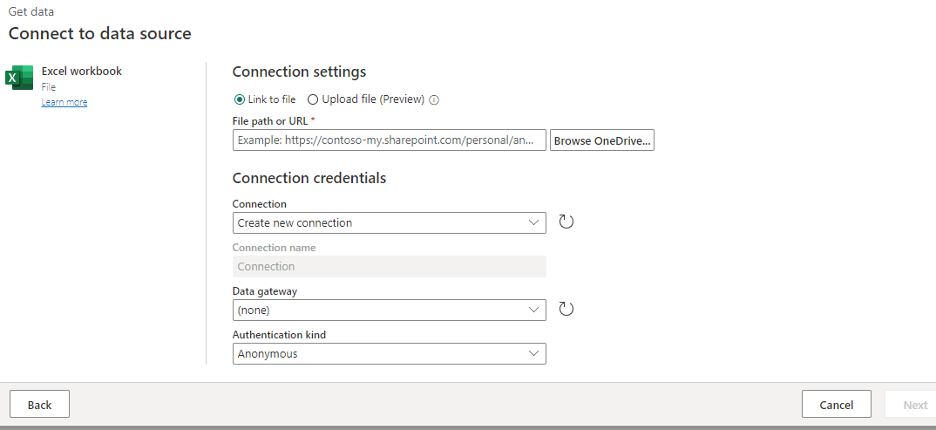
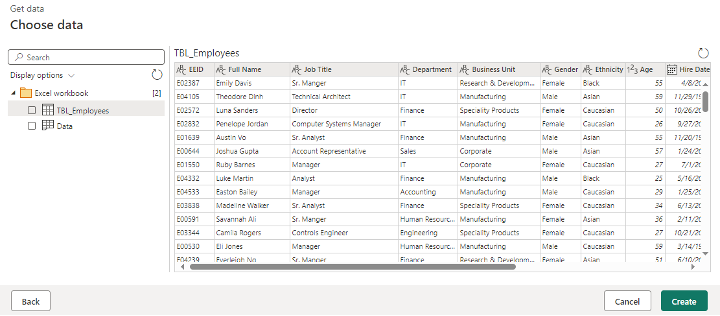
Add the Excel file to the dataflow editor and choose the required files. Select the appropriate one as shown below.
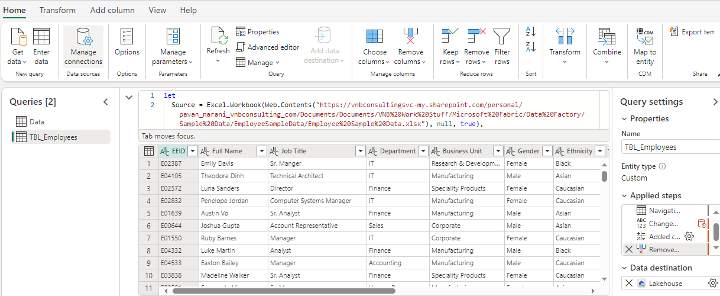
You will see the Dataflow editor as below for all data and fields that were added.
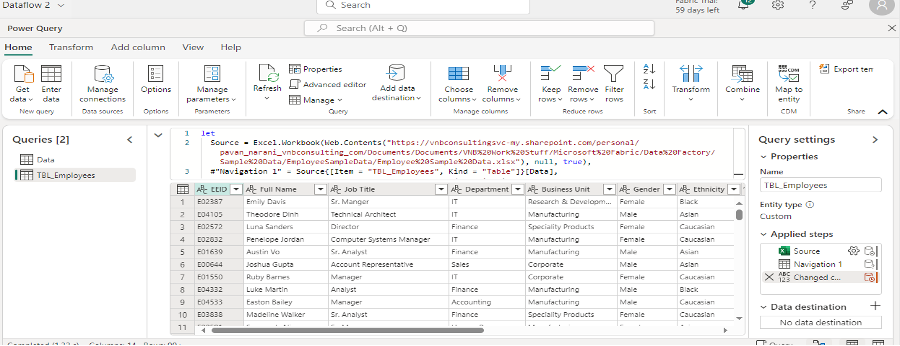
Adding Lakehouse as Destination Source
To add a destination, click on Add to Destination at the bottom right on the Query Setting pane. Choose Lakehouse from the list of options.
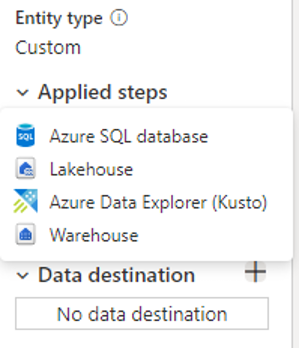 This will open a window to create a connection to Lakehouse. Click on the Next button.
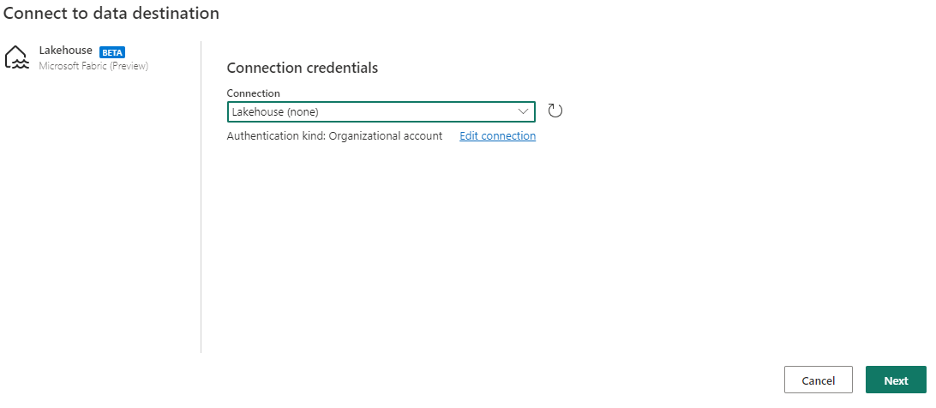
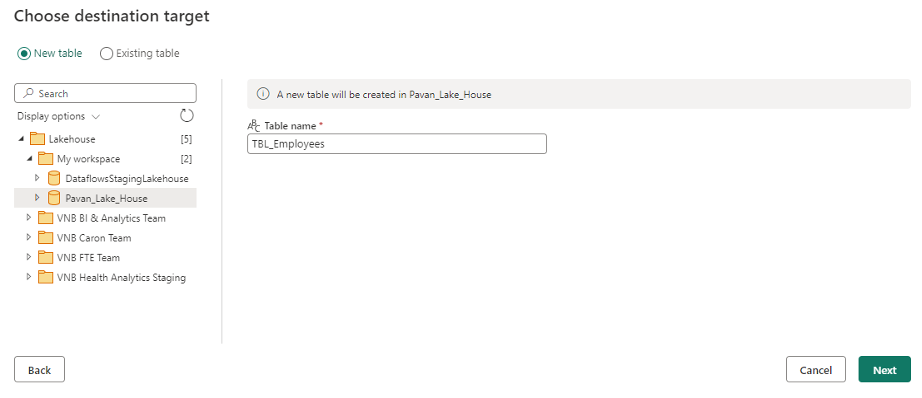
Clicking Next will redirect you to choose the destination target (similar to warehouse). Choose the table names from your Lakehouse, if already created, or create the new table and enter the table names accordingly. In our case, let’s select new table and enter the table name,
Click the Next button to view the predefined mapping. Choose Replace.
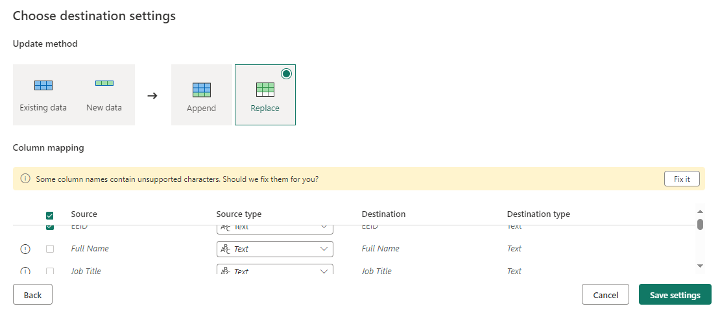
Save the settings. You will be redirected to the Dataflow editor.
Create custom column in the table
Next, we will see how to create a new custom column from existing columns in the same table. In the data pane, scroll to the right on the selected table. You will see “Exit Date” as the last column. To add a new custom column, click on “Add Column” tab at the top of navigation bar and click on custom column.
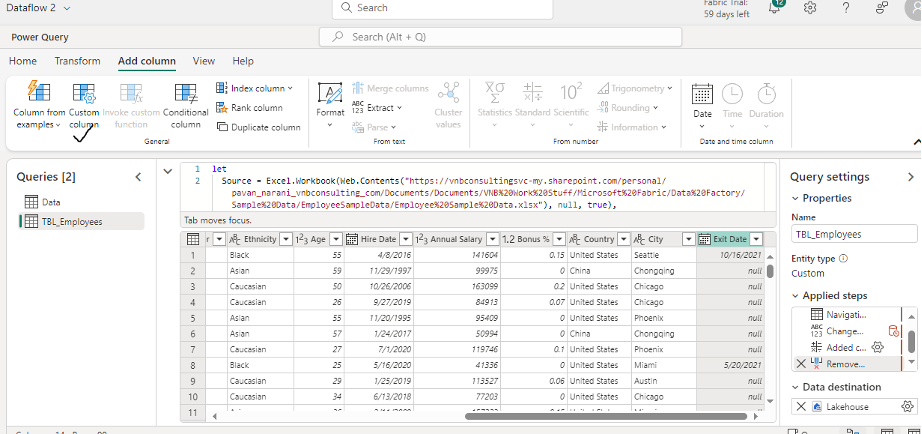
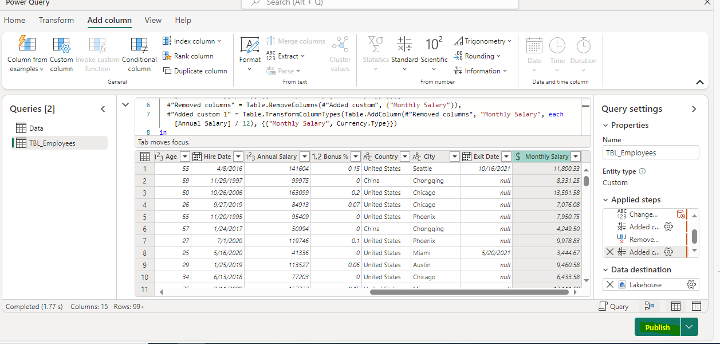
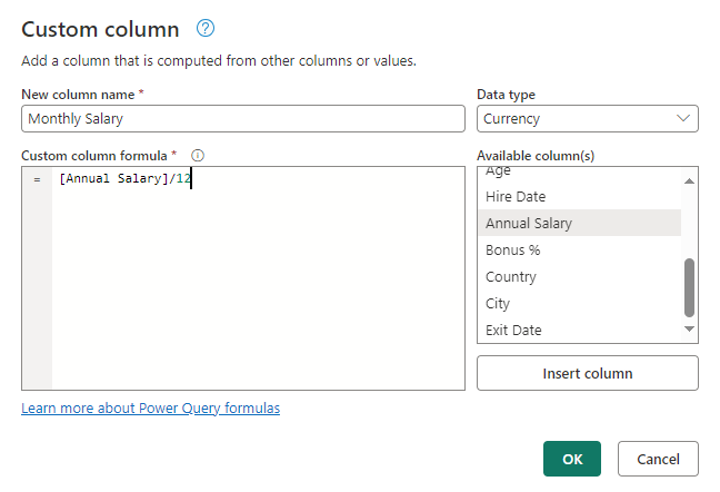
In the new window to create the custom column, enter the column name as Monthly Salary. Choose the datatype as Currency from the dropdown. Select the Annual Salary column from the list and click on Insert column so that it will be added to its left canvas and divide by 12. Click OK as shown below. This will create a new column in the existing table.
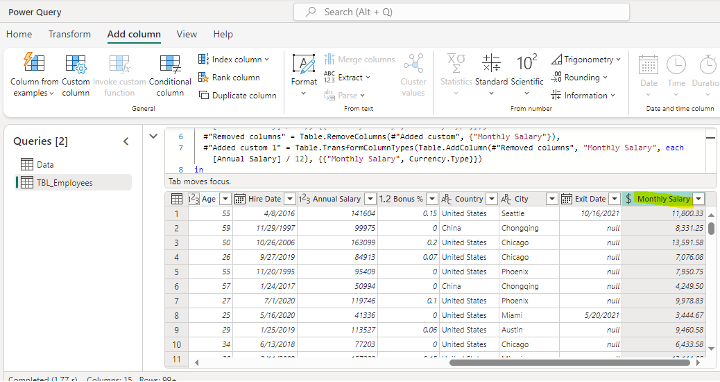
To see the new column, scroll to the extreme right. Also, if you notice, for every transformation, it generates the power queries in the top query editor.
Click the Publish button. As we already configured the destination, you will see the Lakehouse as target endpoint.
Viewing the data in Lakehouse
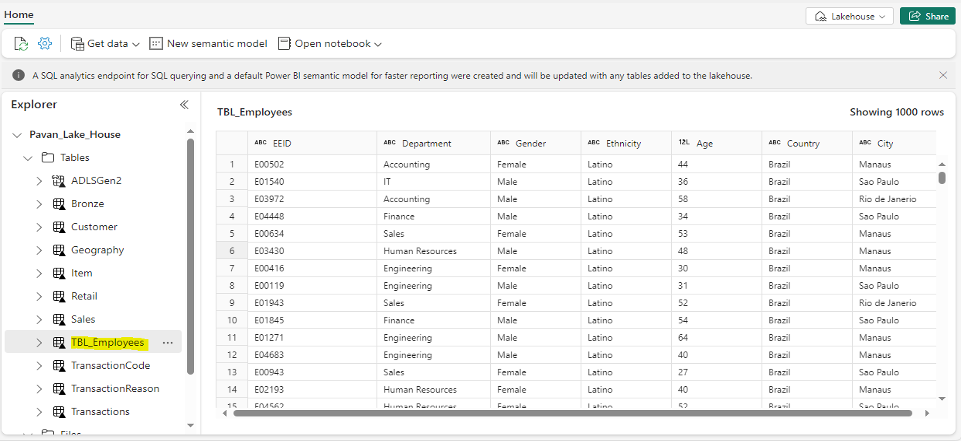
Once you Publish your changes, it will be saved, and the Dataflow will do an auto refresh by its own. This will load the data into target table TBL_Employees. To see the data in the Lakehouse, just open Lakehouse in a separate tab. You can see that the table is loaded with data automatically.
View Dataflow History
To see the history of dataflow, go to Monitoring Hub pane in your workspace. Select the most recent dataflow activity, click on menu and select Historical runs.

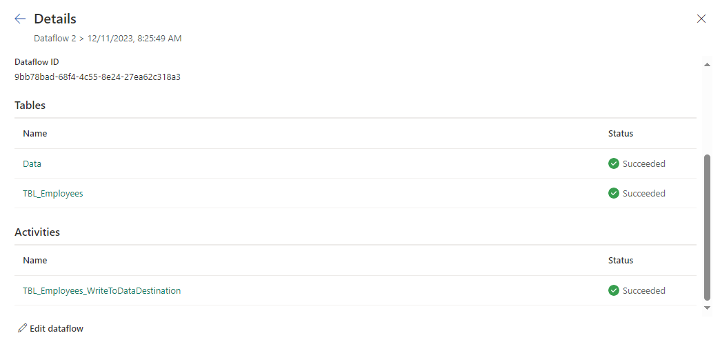
This will show the details and the status of the run.
Wrapping Up
We have taken a look at how we can import data from excel file to Lakehouse with simple transformations using Dataflow. In case you missed out, make sure to check out our previous blogs in this Data Factory using Microsoft Fabric series by clicking the below links. Our next blog in this series will explain how you can perform incremental data load with data pipelines in Microsoft Fabric.
Data Factory in Microsoft Fabric: A Powerful Data Integration Solution
Create Dataflow in Data Factory to Copy Data from Excel Web Source to Warehouse
