BizTalk Server 2016 Feature Pack 1 (v2): Send tracking data to Azure Application Insights

BizTalk Server 2016 Feature Pack 1: Send tracking data to Azure Application Insights
You have configured various tracking options for orchestrations, send ports, receive ports, and pipelines using the BizTalk Server Administration console. And viewed tracked message events, message properties, and message bodies at various stages in a message’s flow in Group Hub pages in BizTalk Server Administration console. This data can be used for troubleshooting or auditing purposes.
The above discussed tracking feature is available in all BizTalk versions, including BizTalk 2016.
Feature Pack 1 goes a step further and provides feature to push the tracking data to Azure Application Insight. This enables non-technical users to troubleshoot and audit BizTalk Applications Tracked information can be monitored on Azure portal or with Power BI tools.
Follow the steps below to send tracking information to Azure Application Insight and then monitor that on Azure Portal:
Install BizTalk Server 2016 Feature Pack 1 on top of BizTalk Server 2016
Download BizTalk Server 2016 Feature Pack 1 from: https://www.microsoft.com/en-us/download
And, install BizTalk Server 2016 Feature Pack 1 on the server where you have BizTalk Server 2016.
Create Application Insight on Azure Portal
1. Create a new instance of “Application Insight” in Azure Portal
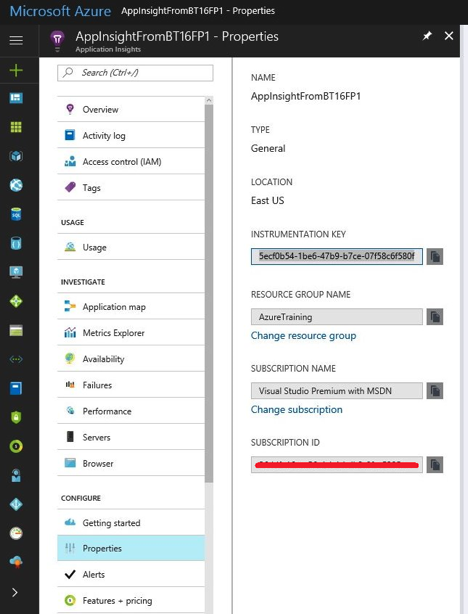
2. Navigate to the application insight you created in above step, Click Properties under Configure section and copy “INSTRUMENTATION KEY” from the blade on right hand side.
This Instrumentation key will be required to configure Analytics in BizTalk environment, in next step.
Configure Analytics for BizTalk Environment
1. Open the BizTalk Server Administration console, expand BizTalk Administration, right-click the BizTalk Group, and select Settings. You notice that Red section, added by feature pack 1 for enabling Analytics.
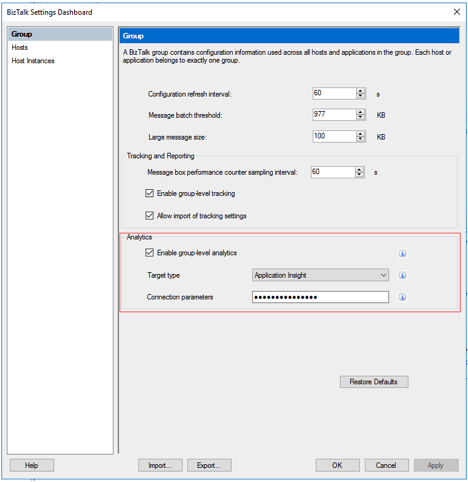
2. Check Enable group-level analytics.
3. For the Target type, select Application Insight from the list.
4. For the Connection parameters, enter your Application Insights instrumentation key copied earlier.
5. Click “OK” to save your settings.
Now, BizTalk Server is ready to transmit data to Application Insights.
Enable Analytics on artifacts
Analytics can be enabled for receive ports, send ports and orchestrations, same like tracking.
Here in this scenario, I am enabling it for receive and send ports.
I have a pure messaging scenario, without orchestration, that receives a text file from one file location and drops at another file location. PassThru pipelines have been used both sides, and filter has been set on send port to subscribe messages from receive port, BTS.ReceivePortName == rcvPort
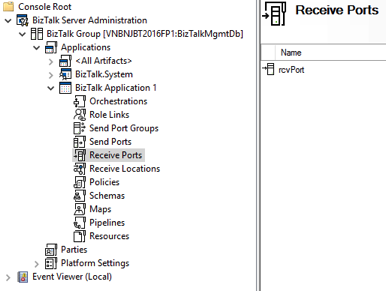
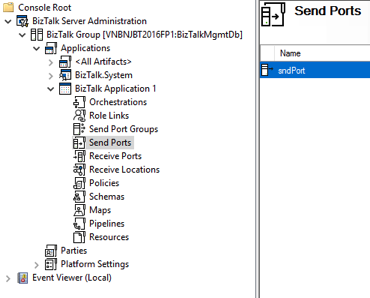
Follow the steps below to enable analytics on these 2 receive and send ports:
1. In BizTalk Server Administration, right-click a receive port and select Tracking.
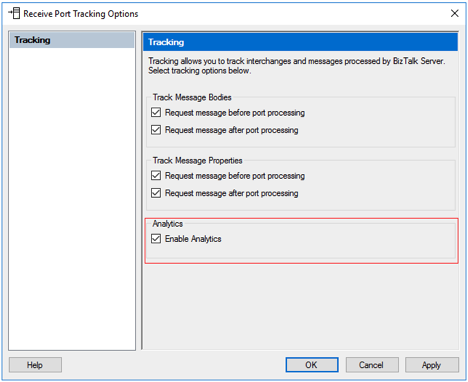
Notice that selection in Red. This was added by Feature Pack1
2. Under Analytics, check Enable Analytics. And click OK to save settings.
This setting starts tracking and transmitting data from the artifact to Azure Application Insights.
Repeat above steps for send port as well.
Run the application once, by dropping sample text file.
1. Go to Azure portal and navigate to Application insight you created earlier.
Check Application Insight on Azure Portal
2. Click on Usage, and check Custom Events section on right blade (Red section below)
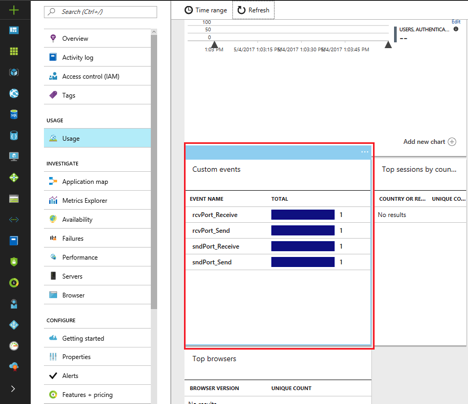
I dropped the file once, and I see 4 events altogether send to Application Insight.
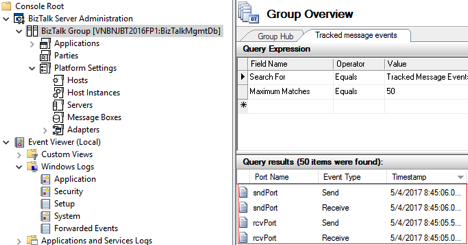
These 4 events are nothing but what you see in Tracked Message Events in Group Hub in BizTalk Admin Console:
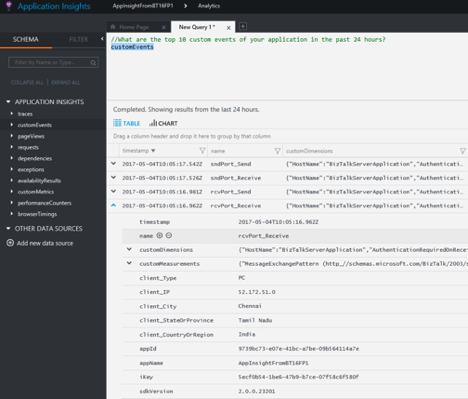
If you click one event, on Azure Portal, you will see all event data:
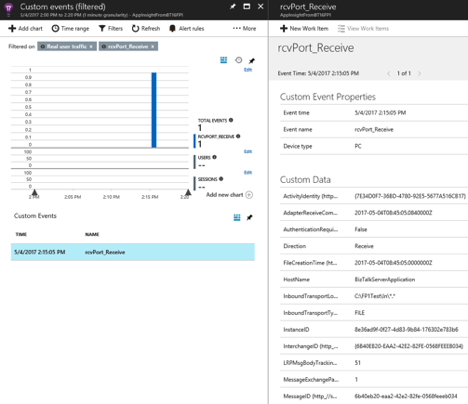
Right most blade in above diagram shows event data, BizTalk 2016 pushed to Application Insight.
Let’s compare Custom Data, shown in right most blade above with what has been tracked in BizTalk server:
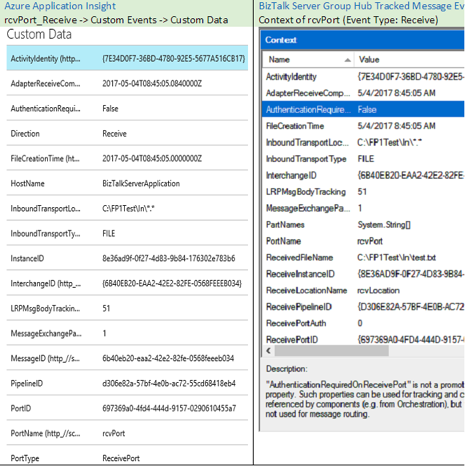
It’s almost same. BizTalk Server pushes all context properties as Custom Data to Azure Application Insight
For more details, you can go to Analytics section directly, as shown below:
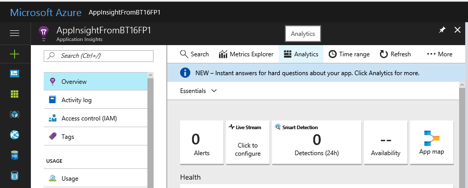
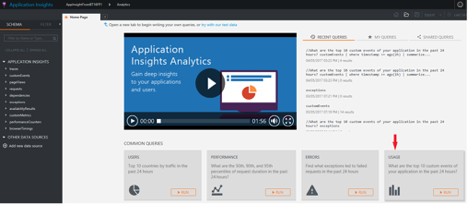
Click on USAGE
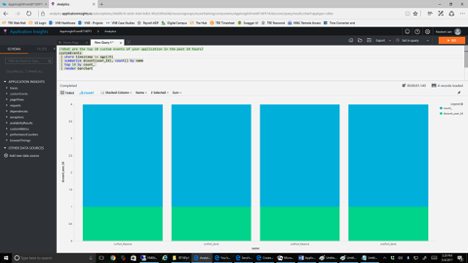
This is all BI stuff now. You can change chart type here, select dimensions and measures etc.
You can check data in Tabular form as well:
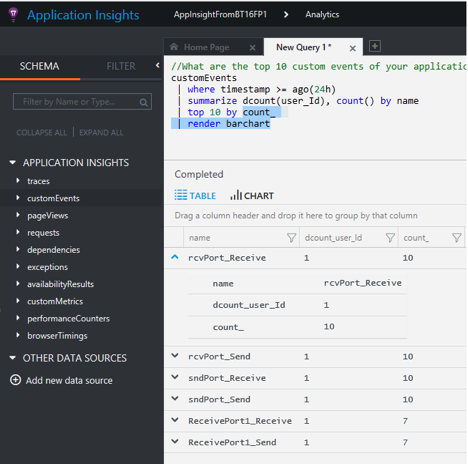
Also, you can modify query on top window and execute it (select the query and click GO on top right)
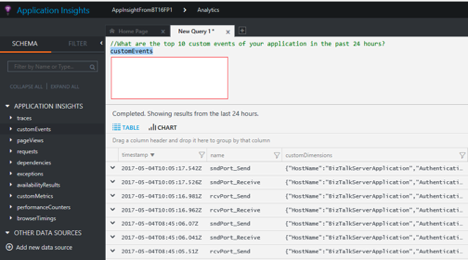
And drill down to details of an event:
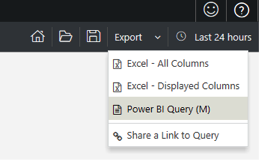
You can export Power BI query, as shown below, and use that with Power BI Desktop tool:
