How to-derive meaningful analytics across disconnected Power BI excels

Quite often, we get requests from our customers on how to go about analyzing data across multiple sheets which contain different types of data and making sense out of it. Here we are walking you through step by step process of how we went about creating a solution for a similar scenario where we will identify what are outstanding customer payments based on excels that contains different geographical locations and customer payments over a period of time.
First and foremost, we always check for the below key points
- Define proper dimensional structure for the data
- Date dimension is required
- Relations between normalization-payee and payee-payment need to be restructured.
- Many-to-many mapping need to be resolved.
- Duplicate values from the dimensional data need to be removed.
Solution:
In this case all the activities can be done easily in Power BI modeling directly.
- Load the 2 excels containing the separate sets of data into PowerBI model using Get Data
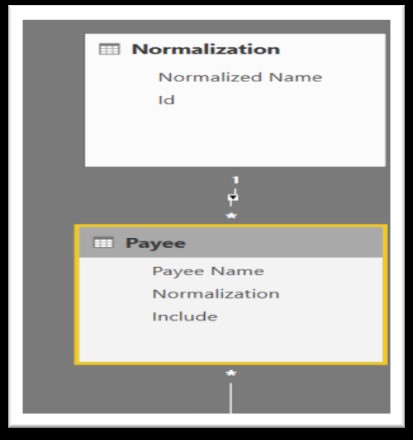
- Create dimensional data for Normalization and Payee with proper one-to-many mapping.
- Add date dimension to the model.
- Create a fact table from the given set of data
- Create relations across the required dimensions
- Once all the above is done, it will look something like below for a sample snowflake model
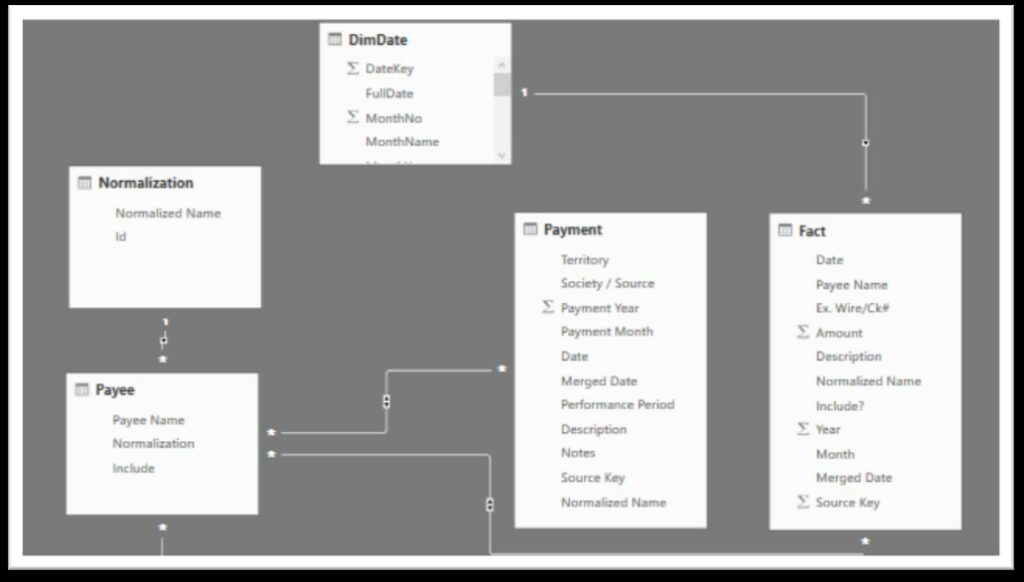
Once all the above steps are complete, data is now ready for slice and dice for the given Normalization, Payee and Territory over a period.