VNB Consulting’s Power BI content pack for HR is a pre-built human resources dashboard with the most used KPIs for HR processes. It offers industry-standard data models, reports, and dashboards with secure access. All human resources dashboard are persona based. In context, the tool explains why there is an increasing emphasis on finding and attracting the best talent. Information is spread out in terms of Powerful Views like Headcount summary, Turnover analytics, Employee Service Record and Job Change Analytics and could be integrated with any data source easily.
Headcount Summary
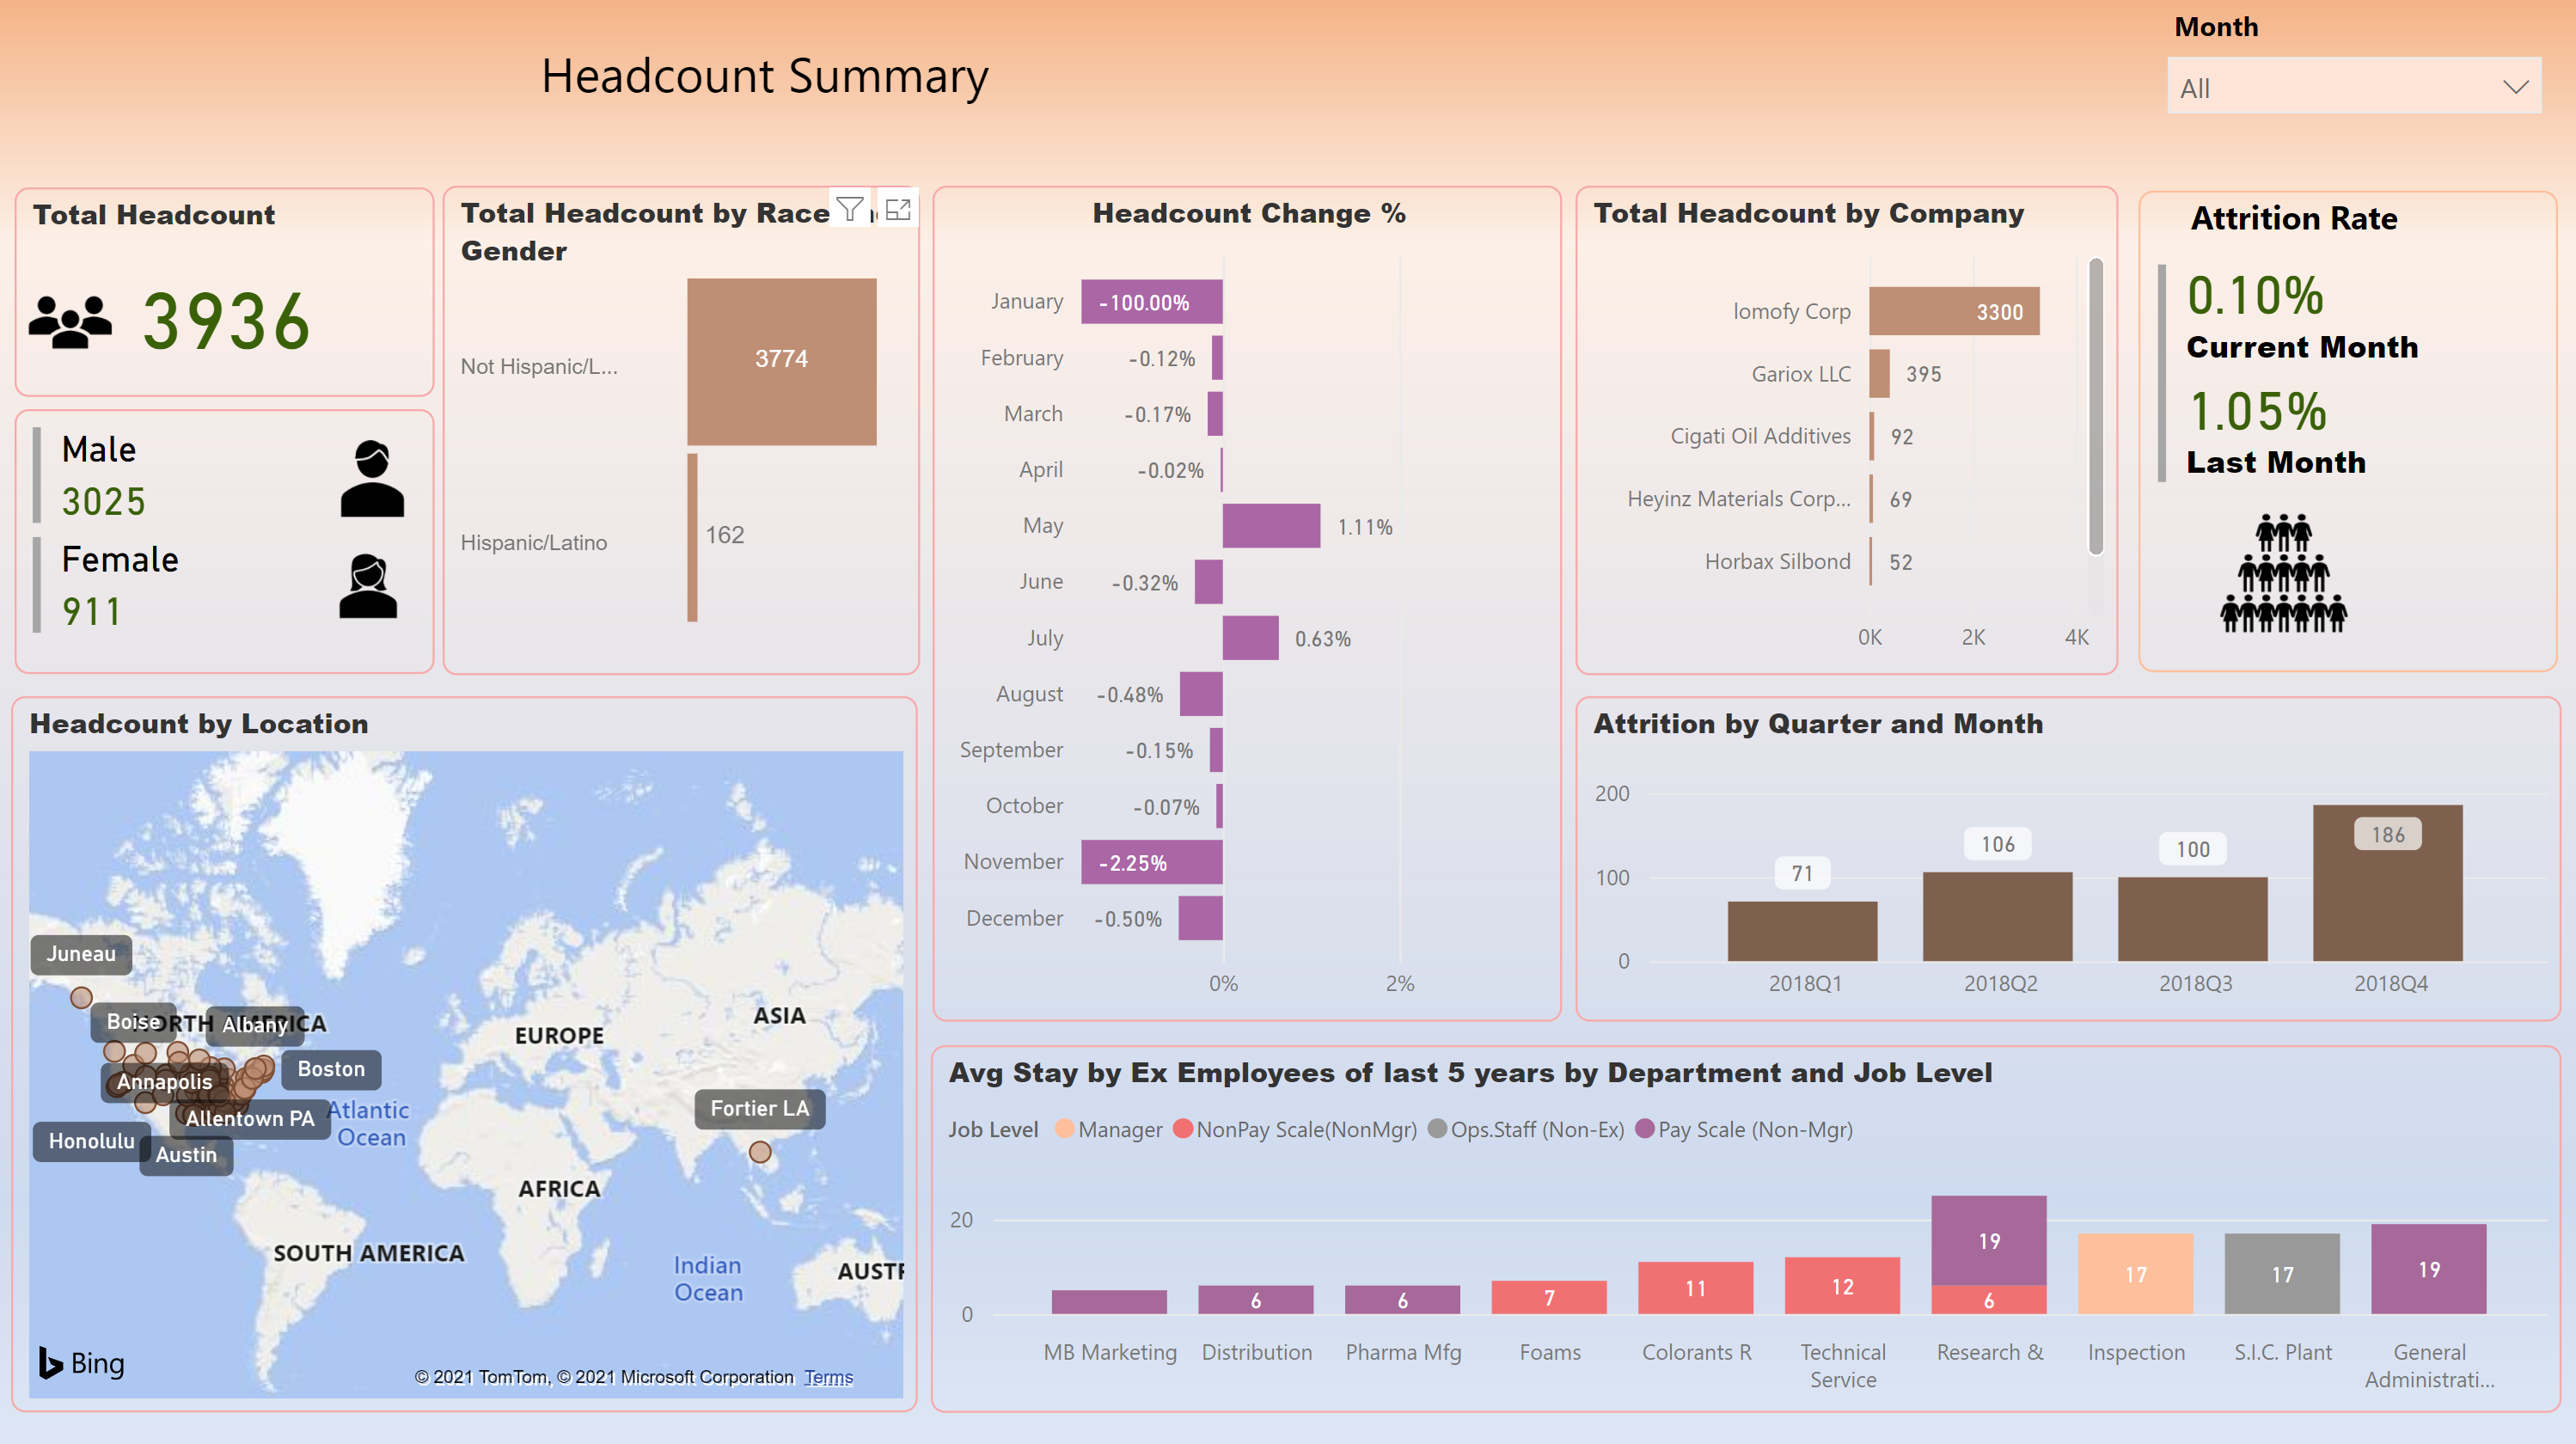
Headcount summary explains present headcount of employees by Location, race, gender, department, company, job level and timeline. It also explains one of the key KPIs i.e., Attrition rate by month.
Turnover Analytics
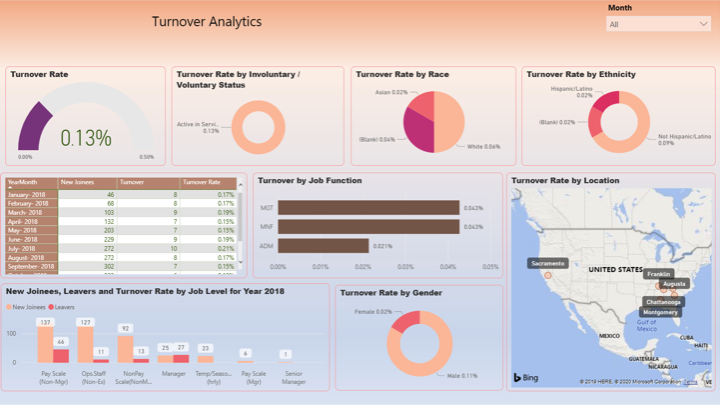
Turnover analytics explains employee turnover rate by involuntary/voluntary status, race, ethnicity, job function and location to understand manpower health KPIs.
Employee Service Analytics
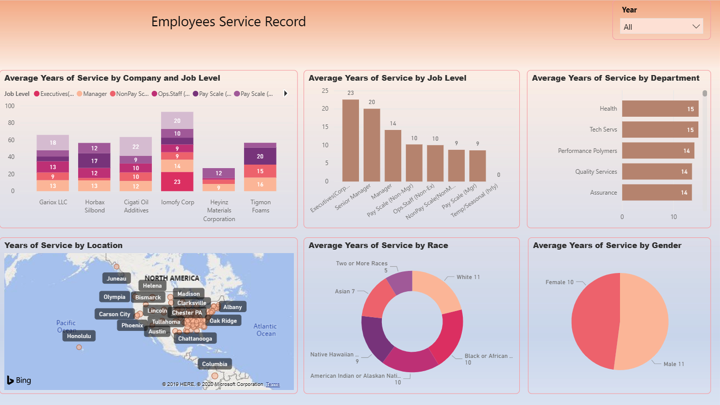
The Employee Service Analytics view explains the average service by employees in its organization by various segments like company, job level, service department and location.
Job Change Insights
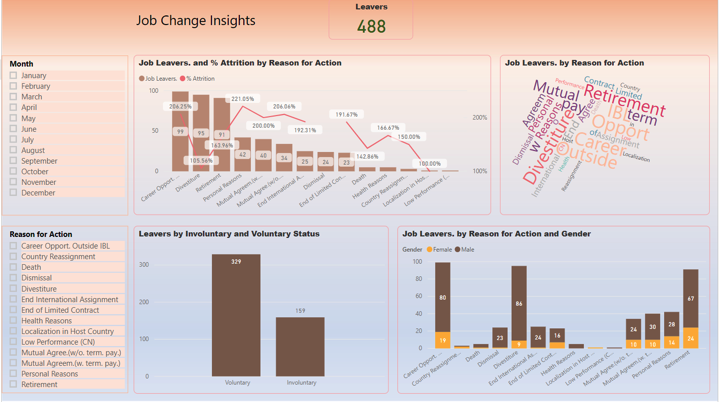
This view lists the people leaving the job by the actual reason for leaving. There can be various reasons to leave the job and HR needs to understand the reason to identify the area of improvement in order to improve the manpower stability.
VNB Consulting’s Power BI content pack for HR is a pre-built human resources dashboard with the most used KPIs for HR processes. It offers industry-standard data models, reports, and dashboards with secure access. All human resources dashboards are persona based. In context, the tool explains why there is an increasing emphasis on finding and attracting the best talent. Information is spread out in terms of Powerful Views like Headcount summary, Turnover analytics, Employee Service Record and Job Change Analytics and could be integrated with any data source easily.


